Find the failed request
Filter the sample capture to errors, select a request, and inspect its response body to see what went wrong.
Explore the traffic inspector →Inspect the HTTP/HTTPS traffic behind failed API calls and slow apps. Replay requests, mock responses and test poor connections in one workspace. Then automate repeatable checks with the built-in REST API. Starts free. No account required.

Scan compact, numbered rows without losing your place. Select a request to see its status, timing and response content; open the full viewer for headers and the complete exchange.
Explore the interactive demo →
Open a captured request as an editable draft. Change its URL, headers or body, then send it and inspect the response beside your input. Repeat the original when you need the same request bytes again.
Each send goes directly to the destination with TLS validation and creates a new numbered capture within your plan’s allowance. Proxy rewrite and throttle rules do not apply to these direct sends.
Try the guided examples →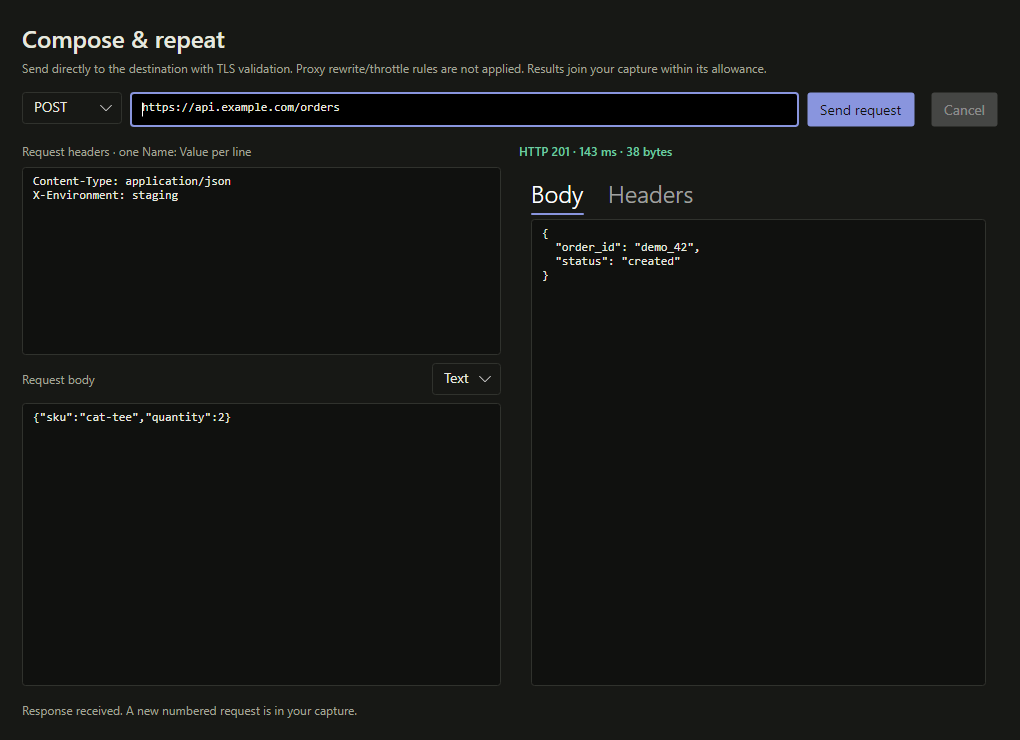
Keep a request as your baseline, select the next attempt, and compare them side by side. See the method, URL, status, timing, headers and body differences without juggling two inspector windows.
Focus on changes only, or format JSON to remove formatting noise. Binary payloads show byte counts and hashes; incomplete captures are labelled, so a missing body never looks like a match.
Explore the sample traffic →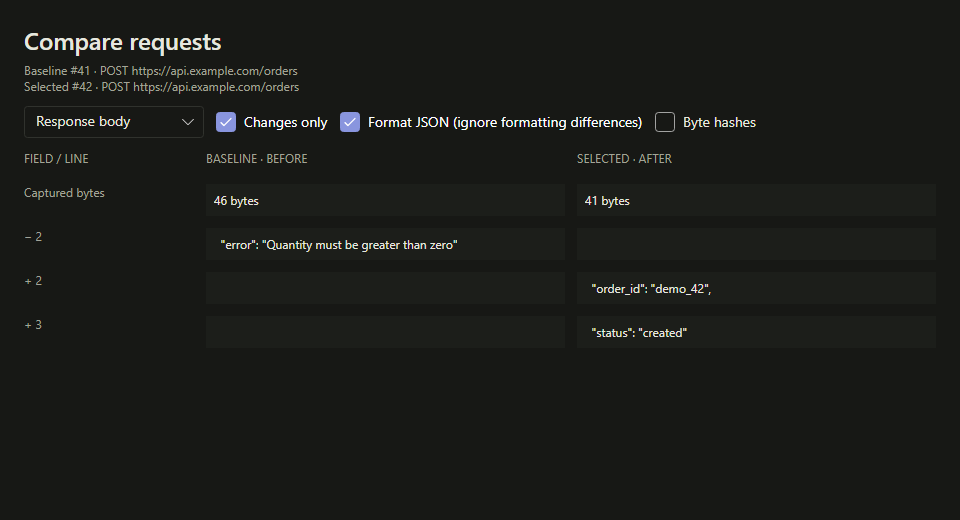
Choose a network profile or set your own latency, response bandwidth and dropped-request rate. Disable HTTP caching and block cookies when you need a fresh, signed-out investigation.
Apply changes explicitly and reset them in one click. Forwarded requests pick up the new conditions; your old captures keep their original timings. Direct Compose sends bypass these controls.
Try the slow-network walkthrough →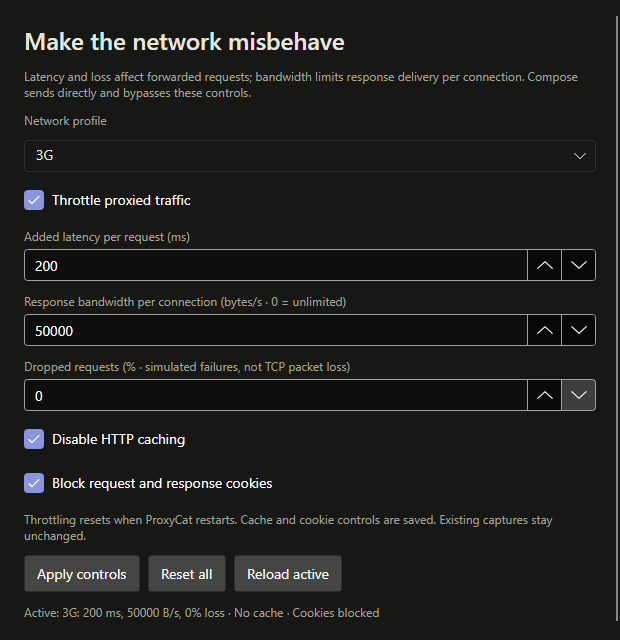
Turn a captured response into an editable mock. Its method, exact URL, status, safe response headers and body are already filled in. Change the result, save the draft, and enable it when you’re ready.
Existing rules stay editable. Text, binary and encoded response bytes are preserved; cookies and transport headers are excluded. Exact HTTPS mocks can answer even when the origin is offline.
Try a profile-response mock →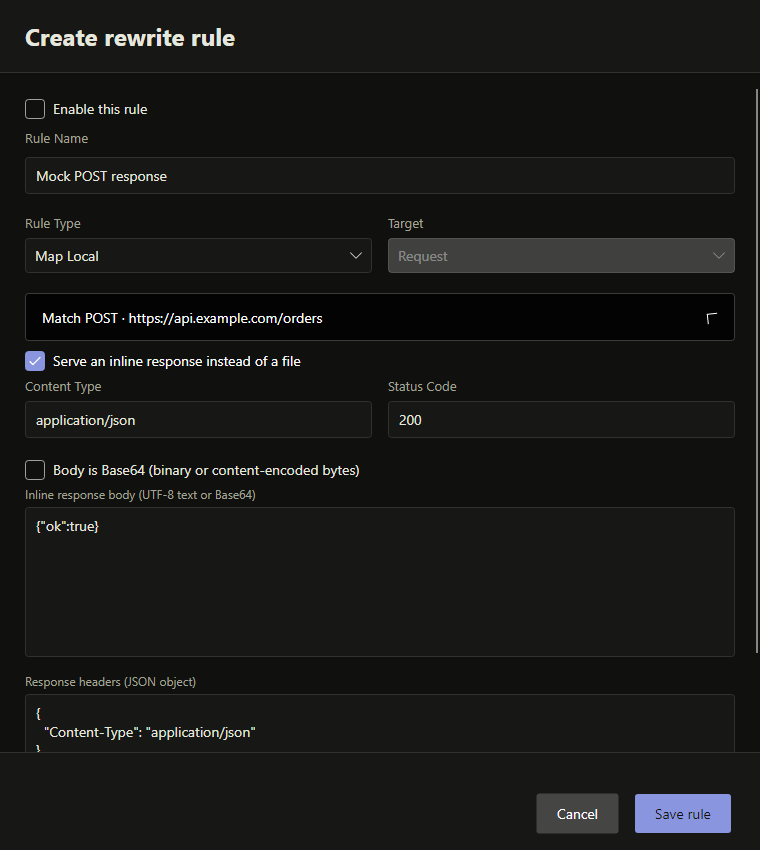
Name an investigation, keep it on your computer, and reopen it from the desktop library. Import or export a .pcsession file when you want to share the full capture. Opening a session asks before replacing your current traffic.
For a bug handoff, share selected requests as a browser report with notes and privacy controls. Your teammate can inspect the file offline without installing ProxyCat.
See what’s included in Pro →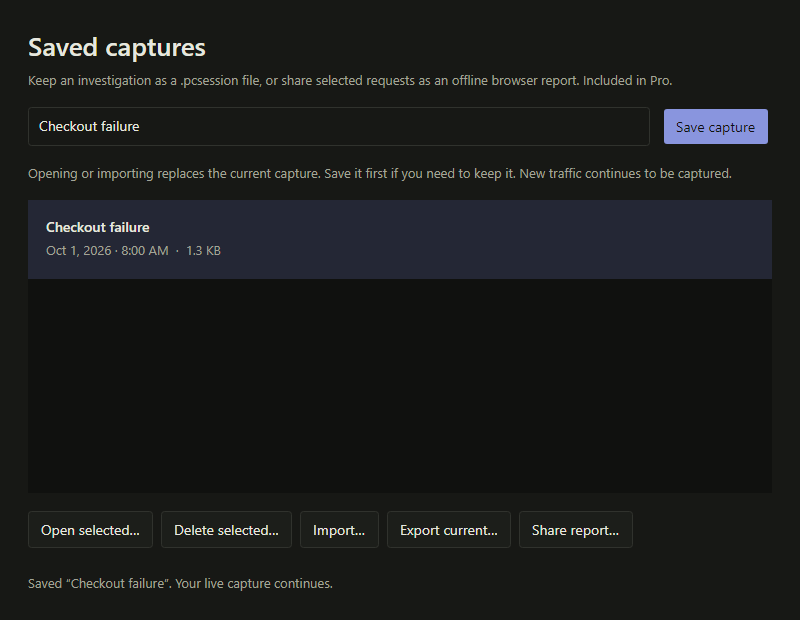
Select the requests that explain a bug, add reproduction notes, and export one HTML file. The recipient can search, sort, and inspect headers and any included text bodies in a browser.
Query values and URL credentials are removed; most header values are hidden and bodies stay out by default. Review paths and notes before sharing. No cloud upload or recipient account required.
Open a sample investigation →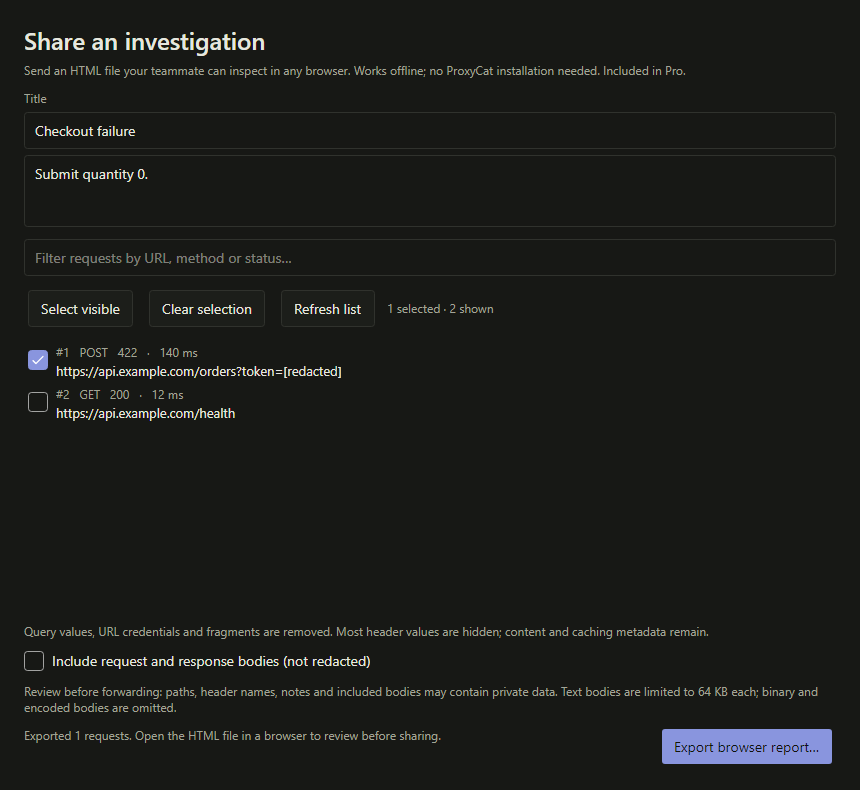
Play a short walkthrough, or advance one step at a time.
Illustrative sample traffic · finite playback · pause or explore at any time · no network requests are sent
/api/Tools/rewrite/api/Tools/throttle/api/ProxyApi/filtersevery click is one curlKeep upstream validation on by default, install the local CA only where you intend to inspect, and follow platform-specific mobile guidance.
The tour points at the live controls so new users can capture traffic, trust certificates, and open settings without hunting.
One binary. Double-click to launch. No installer, no Java runtime, no Docker required. The proxy starts automatically on port 8888.
Set localhost:8888 as your HTTP proxy. Works with browsers, mobile apps, React, Node, Python — anything that speaks HTTP.
Every request appears instantly in the desktop app. Then automate — create rewrite rules, throttle profiles, and filters via the REST API. No clicking required.
Inspect HTTP/HTTPS with your own local root CA. Guided desktop and mobile setup helps you configure clients that support proxying and trust the certificate.
Map Remote, Map Local, header inject/modify/remove, body find & replace, URL rewriting, status code overrides. All via API or GUI.
14 built-in presets from 56K modem to 5G fiber. Custom latency, bandwidth caps, and packet loss simulation. Test edge cases instantly.
Use the full-text REST search to match URLs, headers and request/response bodies. The desktop’s fast view filters narrow traffic by URL, method and status.
Open a captured request as a draft, edit its URL, headers and body, or repeat its original bytes. Inspect the response beside your draft; new results join the numbered capture.
A desktop library for named captures on Pro. Reopen investigations, exchange .pcsession files, or share selected requests and notes as an offline browser report. Recipients need no installation to review the report.
Export to standard HTTP Archive format. Import into Chrome DevTools, Lighthouse, or any HAR-compatible tool for further analysis.
Get notified via Slack in real-time when specific patterns appear. Monitor for 5xx errors, slow responses, or custom conditions. Email notifications coming soon.
Core proxy workflows exposed via a clean REST API with OpenAPI docs. Script your proxy config in CI/CD, tests, or any language you use.
Use MCP to find failed calls, compare response times and spot large responses from your own AI client. Share capture metadata for this app session; keep headers and payloads in the inspector.
See MCP examples →Graphite Dark, warm-paper Light, moss-green Forest and deep-blue Aqua. Switch in Settings; your workbench, dialogs and inspectors follow the same palette.
The account service handles sign-in and licensing. Your desktop captures and local CA stay on your machine. You choose what to export, share or expose to an MCP client.
| Workflow | In the app | Through the API |
|---|---|---|
| Inspect traffic | Browse requests, headers, bodies, and timing | List captured requests and search traffic |
| Change responses | Create rewrite and mapping rules | Configure rules from your scripts |
| Test slow networks | Choose a throttling preset | Apply repeatable network conditions |
| Reproduce a request | Replay a capture or compose a request | Send requests from automated tests |
| Share a capture | Sessions → Share report | Export selected requests and notes for offline browser review |
localhost:8888, install the root cert once, and your team is capturing HTTPS traffic. Import your Charles .p12 cert if you want to keep the same certificate chain.Connect your MCP-compatible AI client to the requests you capture locally. Ask it to find failures, compare status codes and timings, or highlight large responses. Open the request in ProxyCat when you need to inspect headers or payloads.
“Show the failed POSTs to api.example.com.”
proxycat_list_requests. This is a sample, not a live AI response. The client can inspect an individual capture with proxycat_get_request and check capture state with proxycat_status.Access is off by default and ends when ProxyCat closes. MCP exposes hostnames, methods, status codes, timestamps, timings and byte counts. URL paths, queries, headers and bodies are omitted. Your AI client may send the shared metadata to its provider. MCP access is read-only; it cannot change rules or send requests.
curl awayPay once. Keep your eligible version. Renew updates only when you want to.
All downloads also include a standalone headless server binary in the server/ subfolder.
Filter the sample capture to errors, select a request, and inspect its response body to see what went wrong.
Explore the traffic inspector →Toggle a demo rewrite rule and compare the result. Watch the equivalent API call appear alongside the capture.
Try a rewrite rule →Preview and export the sample session as HAR, then use the same workflow with your own captures in ProxyCat.
Preview a HAR export →Actually free. No time limit, no credit card, no account required. Download the binary and use it forever. The free tier includes all core features — SSL interception, all rewrite types, all 14 throttle presets, full-text search, replay, compose, and full REST API access. The free tier is limited to 1,000 captured requests/day and 10 filter rules; HAR export, session save/load, and Slack alerts are Pro features.
Your eligible purchased version keeps its Pro features permanently. New releases dated after your update cutoff need an optional $39 renewal, which adds 12 months from your current cutoff or the renewal date, whichever is later. There is no automatic renewal. One license covers one person and three device activations; teammates need their own licenses. Start with Free to evaluate the core workflow.
ProxyCat combines a visual traffic inspector with 60+ REST API endpoints. Inspect requests in the app, then script your filters, rewrite rules, and throttling for repeatable tests. Self-contained downloads include the runtime, and headless mode supports automation without opening the desktop app.
Download the binary, run it, set your browser or device proxy to localhost:8888, and install the root certificate once. If you're using Charles certificates in your app, you can import your existing .p12 file via the Cert Viewer. Your filters and rewrite rules are JSON — version-control them from day one.
mitmproxy's Python addon system is powerful but forces you to write and maintain proxy code in a specific runtime. ProxyCat exposes everything via a clean REST API — use any language, any tool, any CI platform. Run rewrite rules in your test suite with two curl commands. No Python environment to manage, no addon reload cycle. Every desktop download also includes a standalone headless server; a public Docker release is planned.
Absolutely. Every download includes a headless server binary you can run without a GUI. A public Docker image is planned. Set up rewrite rules, filters, and throttle profiles with curl commands in your pipeline scripts. Teams use it to mock external APIs in integration tests and simulate network failures. Pro features on a server (HAR export, unlimited captures) come from a licence you create on your account page — Use Pro on a server or in CI — and pass as PROXYCAT_LICENSE. Each server or CI job uses one of the three device activations included with that individual user's license. A perpetual license keeps eligible releases in Pro permanently; reissue it after renewing updates to include the new cutoff.
ProxyCat generates a local root CA on first launch. Configure the device’s HTTP proxy and install and trust that CA for HTTPS inspection. Desktop browsers and Android/iOS clients that honor the proxy and trust the CA are supported; certificate-pinned apps and clients that ignore system proxy settings need app-specific configuration. Guided setup explains the platform steps.
At 1,000 captured requests in a day, new requests stop being captured but the proxy keeps forwarding traffic normally — nothing breaks. Your existing captures, search, and REST API all keep working, and the counter resets at midnight UTC. No forced upgrades, no nag screens. Upgrade to Pro when (and if) you need unlimited.
Yes. Rewrite rules and filter sets are plain JSON on every plan — read them from the API or version-control the files in your data directory alongside your test suites. Pro includes full .pcsession file exchange and selected-request HTML reports for offline browser review. Reports hide most header values and all query values; bodies are optional and aren't automatically redacted. There is no hosted workspace or access-controlled sharing link yet. Pro licenses cover one person each; contact sales for negotiated volume pricing if you're buying for a team.
Inspect what your app sends, change what comes back, and reproduce the bug. Start with the free tier. No account or credit card required.